Private Health Insurance Switching: HCF, Bupa, and ahm see biggest customer growth

New data from Roy Morgan shows that despite rising cost-of-living pressures, most Australians are maintaining private health insurance rather than opting out, but they’re switching.
As of December 2024, over half of Australians aged 14+ (57.2%) hold a private health insurance policy - equivalent to approximately 12.9 million people. This represents steady growth over the past five years, rising from 52.9% in December 2020 to 57.2% in December 2024.
Chart 1: Percentage of Australians holding a private health insurance policy

Source: Roy Morgan Single Source (Australia) Jan20-Dec24, n= 64,823.
Base: Australians 14+.
Health Insurance Switching Dynamics
The increasing cost of living since late 2021 is putting pressure on family budgets and driving more people to look around for the best deals on offer, although most are still deciding to renew their policies with the same company.
In the year to December 2024, 6.8% of private health insurance policies switched to another company, and 17.9% were renewed after approaching another company. In total, close to one in four (24.6%) people looked for a better health insurance policy deal, up from 22.3% in the year to December 2023.
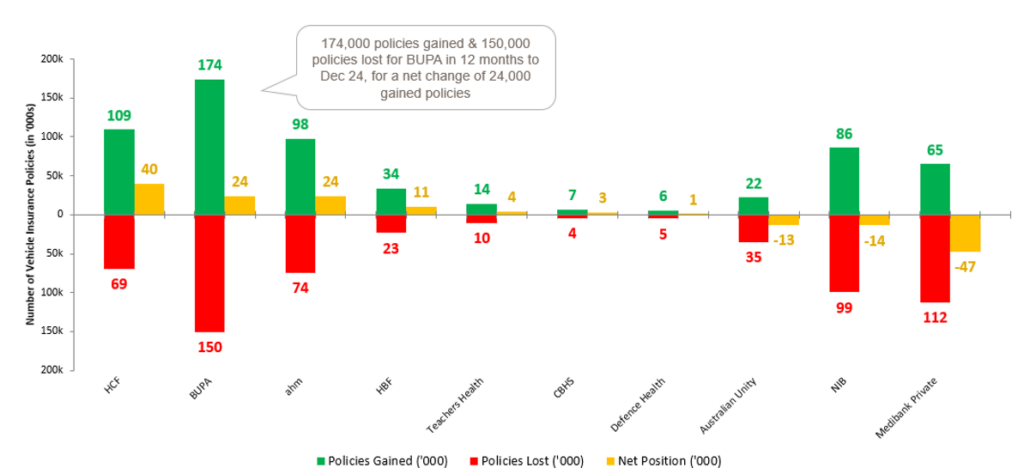
Among health insurers, HCF, Bupa, and ahm have been the biggest winners from customer switching in the past 12 months, benefiting from their reputation for competitive pricing:
- HCF: Gained 109,000 customers while losing 69,000, resulting in a net increase of 40,000.
- Bupa: Gained 174,000 customers while losing 150,000, for a net increase of 24,000.
- ahm: Gained 98,000 customers while losing 74,000, also achieving a net increase of 24,000.
In contrast, Medibank Private saw the largest customer loss due to switching, gaining only 65,000 customers while losing 112,000, leading to a net loss of 47,000.
These figures highlight a trend of consumers prioritising cost-effective options when choosing private health insurance, reinforcing the importance of competitive pricing in the sector.
Chart 2: Health insurance companies switched to/ switched out from (‘000s)
Source: Roy Morgan Single Source Australia, Jan24 – Dec24, n = 64,823.
Base: Private health insurance switchers 14+ excluding “Can’t Say institution”.
*Net position may not exactly equal gains minus losses due to rounding.
Suela Qemal, General Manager of Financial Services, Roy Morgan, says an increasing percentage of Australians have a private health insurance policy, despite the cost-of-living crisis:

“The findings are really interesting – most Australians are not choosing to go without private health insurance despite the cost-of-living crisis – the majority of Australians 14+ are covered by private health insurance (57.2%).
“Nevertheless, the cost-of-living crisis is manifesting itself in different ways, in particular, Australians are more willing to switch to companies that are recognised for providing cost effective options.
“These figures show the number of policies being switched increased in the last year coincides with continuing higher interest rates, and higher than inflation increases in rental accommodation prices. These pressures are clearly leading people to monitor their ongoing costs closely.
“Our data scientists analysed Roy Morgan’s information, derived from in-depth personal interviews conducted with over 1,000 Australians per week (over 60,000 per year).
“With all the discussion about cost of living, we at Roy Morgan turned our focus to the issues of health.”
To learn more about Roy Morgan’s detailed health insurance data call (+61) (03) 9224 5309 or email askroymorgan@roymorgan.com.
Please click on this link to the Roy Morgan Online Store to view additional in-depth reports and profiles on consumer data in the finance and insurance industries.
Margin of Error
The margin of error to be allowed for in any estimate depends mainly on the number of interviews on which it is based. Margin of error gives indications of the likely range within which estimates would be 95% likely to fall, expressed as the number of percentage points above or below the actual estimate. Allowance for design effects (such as stratification and weighting) should be made as appropriate.
| Sample Size | Percentage Estimate |
| 40% – 60% | 25% or 75% | 10% or 90% | 5% or 95% | |
| 1,000 | ±3.0 | ±2.7 | ±1.9 | ±1.3 |
| 5,000 | ±1.4 | ±1.2 | ±0.8 | ±0.6 |
| 7,500 | ±1.1 | ±1.0 | ±0.7 | ±0.5 |
| 10,000 | ±1.0 | ±0.9 | ±0.6 | ±0.4 |
| 20,000 | ±0.7 | ±0.6 | ±0.4 | ±0.3 |
| 50,000 | ±0.4 | ±0.4 | ±0.3 | ±0.2 |


